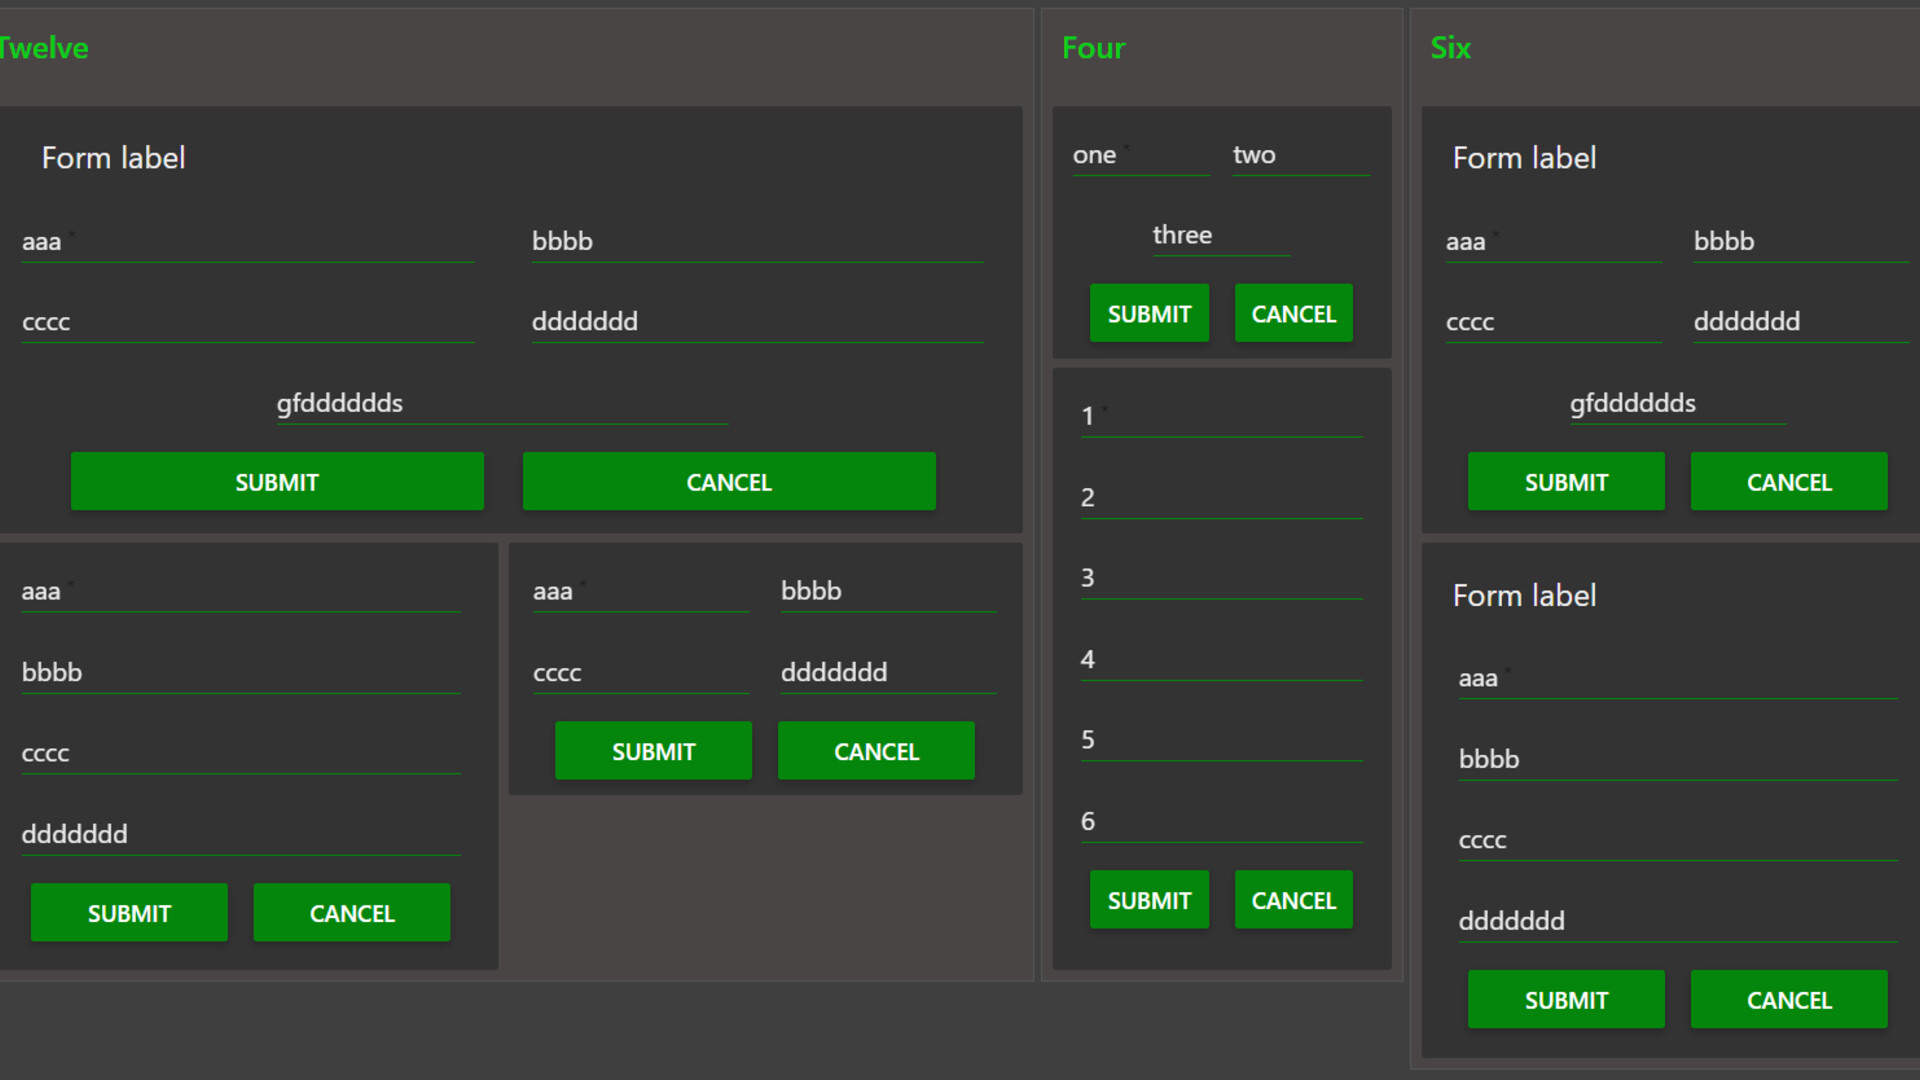
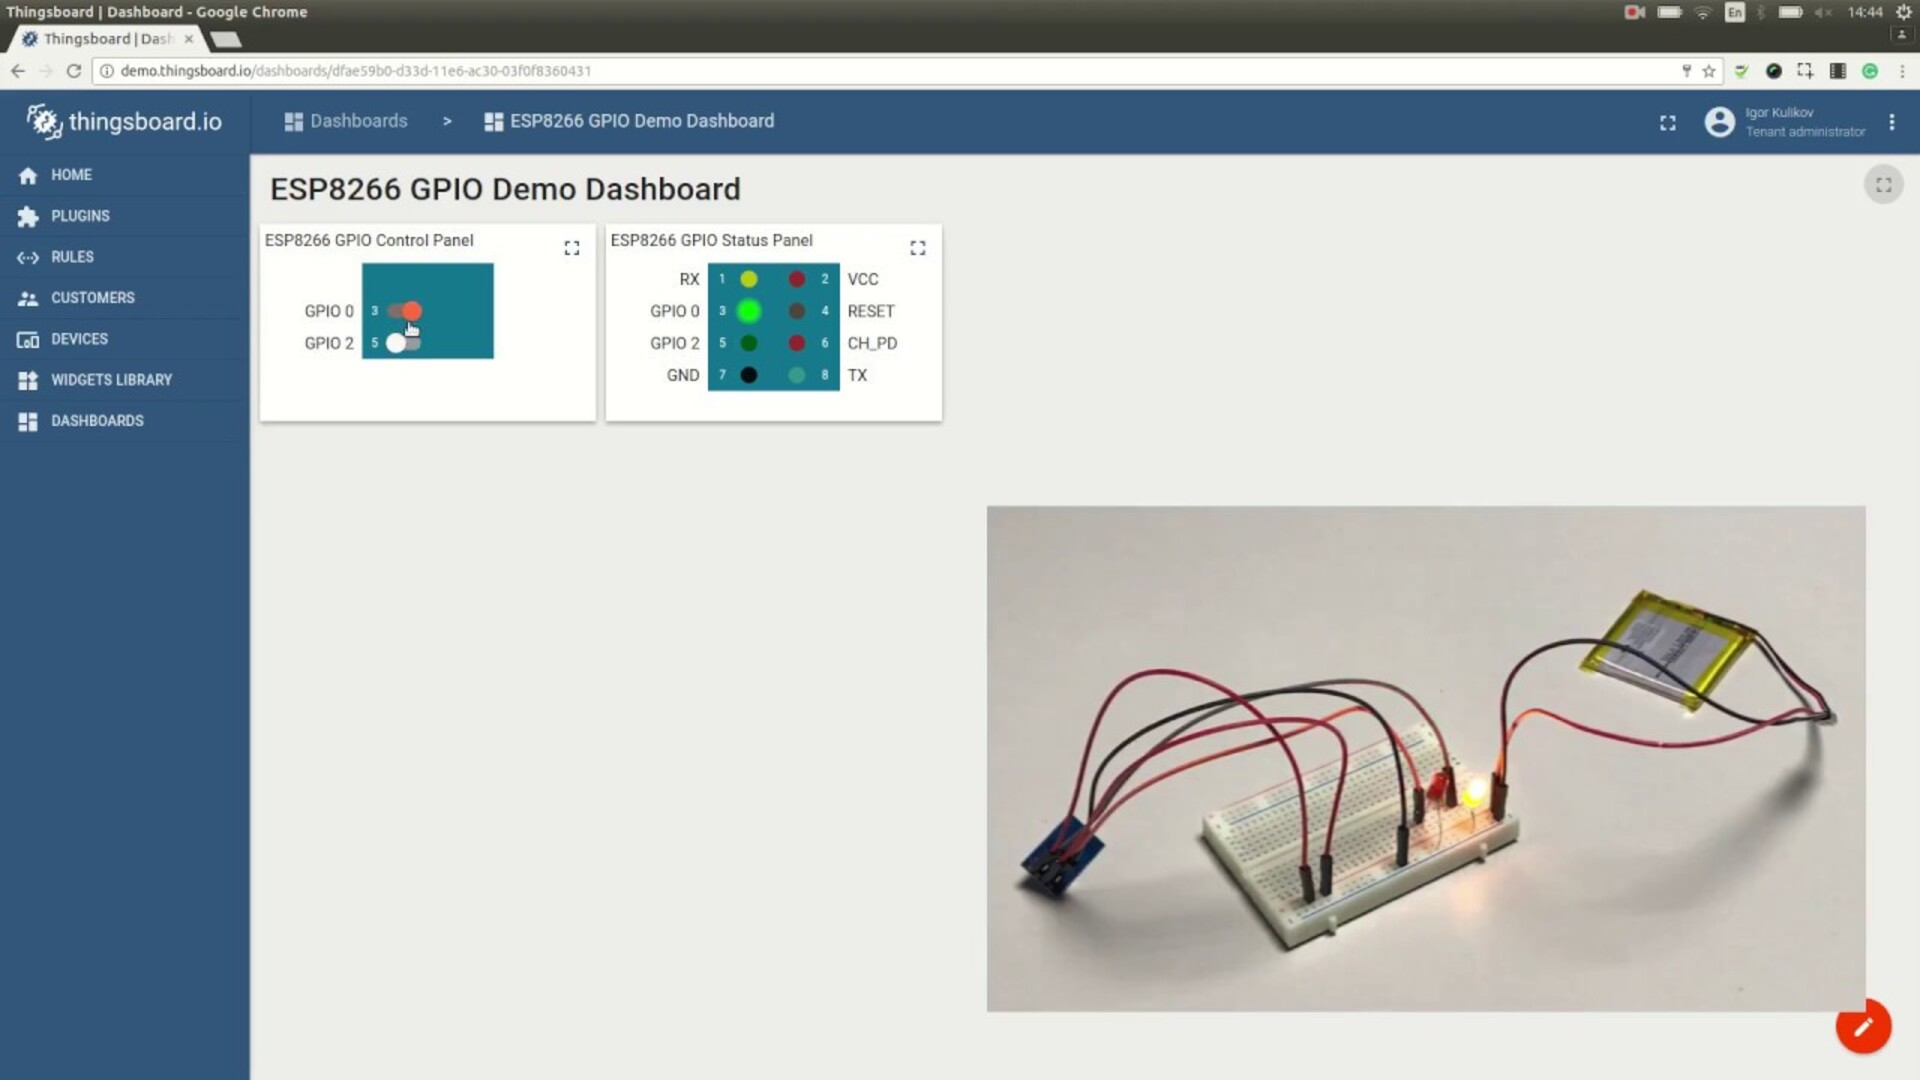
Step-by-step tutorial on creating beautiful, real-time dashboards for your IoT data using Node-RED and various visualization nodes.
Introduction
Node-RED's dashboard feature provides a quick and easy way to create live, interactive dashboards for your IoT data. In this comprehensive tutorial, we'll build a complete real-time monitoring dashboard that displays sensor data, charts, and controls.
Prerequisites
- Node-RED installed (version 2.0+)
- node-red-dashboard palette installed
- Basic understanding of Node-RED flows
- Optional: MQTT broker (Mosquitto) for real data
Installing Dashboard Nodes
First, install the dashboard nodes:
- Open Node-RED and go to the menu (≡)
- Select "Manage palette"
- Go to the "Install" tab
- Search for "node-red-dashboard"
- Click "Install" on the node-red-dashboard package
Dashboard Structure
The dashboard is organized hierarchically:
- Dashboard: The top level
- Tabs: Major sections (e.g., "Overview", "Details")
- Groups: Sections within tabs (e.g., "Temperature", "Humidity")
- Widgets: Individual UI elements (gauges, charts, etc.)
Project: Smart Home Monitoring Dashboard
Step 1: Simulate Sensor Data
We'll start by creating simulated sensor data. Drag an "inject" node and "function" node onto the canvas:
// Function node: Generate Sensor Data
const temperature = 20 + Math.random() * 10;
const humidity = 40 + Math.random() * 30;
const pressure = 980 + Math.random() * 40;

msg.payload = {
    temperature: parseFloat(temperature.toFixed(1)),
    humidity: parseFloat(humidity.toFixed(1)),
    pressure: parseFloat(pressure.toFixed(1)),
    timestamp: new Date().toISOString()
};

return msg;
Configure the inject node to repeat every 2 seconds.
Step 2: Creating Gauge Widgets
Add a "gauge" node for each metric:
Temperature Gauge:
- Label: Temperature
- Value format: {{value}}°C
- Range: 0 to 40
- Color gradient: blue to red
- Sectors: 0-15 (blue), 15-25 (green), 25-40 (red)
Connect a "change" node before the gauge to extract the value:
// Set msg.payload to msg.payload.temperature
msg.payload = msg.payload.temperature;
return msg;
Repeat for humidity and pressure with appropriate ranges.
Step 3: Time-Series Charts
Add a "chart" node for historical data visualization:
Configuration:
- Type: Line chart
- X-axis: Last 10 minutes
- Legend: Show
- Interpolation: Linear
- Width: 12 (full width)
// Function node: Prepare Chart Data
msg.payload = [
    {
        "series": ["Temperature"],
        "data": [[msg.payload.temperature]],
        "labels": [""]
    },
    {
        "series": ["Humidity"],
        "data": [[msg.payload.humidity]],
        "labels": [""]
    }
];

return msg;
Step 4: Adding Controls
Create interactive controls to simulate device operations:
Switch for Light Control:
- Drag a "switch" node
- Label: Living Room Light
- On Payload: {"device":"light1","state":true}
- Off Payload: {"device":"light1","state":false}
Slider for Thermostat:
- Drag a "slider" node
- Label: Target Temperature
- Range: 16 to 30
- Step: 0.5
Step 5: Text and Notification Widgets
Text Display:
// Function node: Format Status Message
let status = "All systems operational";
if (msg.payload.temperature > 30) {
    status = "⚠️ High temperature alert!";
} else if (msg.payload.humidity > 70) {
    status = "⚠️ High humidity detected";
}

msg.payload = status;
return msg;
Notification Node:
// Function node: Trigger Notifications
if (msg.payload.temperature > 35) {
    return {
        payload: "Critical: Temperature exceeds 35°C!"
    };
}
return null; // No notification
Step 6: Creating Multiple Tabs
Tab 1: Overview
- Current sensor readings (gauges)
- Status messages
- Quick controls
Tab 2: History
- Time-series charts
- Data tables
- Export functionality
Tab 3: Settings
- Configuration options
- Alert thresholds
- Device management
Step 7: Styling the Dashboard
Customize the appearance:
- Go to Dashboard > Site tab
- Configure:
- Theme: Dark or Light
- Base font size: 12px - 16px
- Widget margins: Adjust spacing
- Layout: Columns (width units)
Custom CSS:
/* Add in Dashboard > Site > Style */
.nr-dashboard-theme {
    background-color: #1a1a1a;
}

.nr-dashboard-cardtitle {
    color: #FFD700;
}

.nr-dashboard-gauge text {
    font-size: 24px !important;
    font-weight: bold;
}
Step 8: Connecting Real Data (MQTT)
Replace simulated data with real MQTT sensor data:
- Drag an "mqtt in" node
- Configure:
- Server: localhost:1883 (or your broker)
- Topic: sensors/temperature
- QoS: 0
- Add a JSON node to parse incoming data
- Connect to your dashboard widgets
// MQTT message format
{
    "device_id": "sensor_001",
    "temperature": 23.5,
    "humidity": 55.2,
    "timestamp": "2025-11-18T10:30:00Z"
}
Step 9: Data Logging and Persistence
Store historical data in a database:
// Function node: Prepare for Database
msg.topic = "INSERT INTO sensor_data (device_id, temperature, humidity, timestamp) VALUES (?,?,?,?)";
msg.payload = [
    msg.payload.device_id,
    msg.payload.temperature,
    msg.payload.humidity,
    msg.payload.timestamp
];

return msg;
Add a "sqlite" or "mysql" node to persist data.
Step 10: Advanced Features
Context Menu: Right-click menu options for quick actions
Audio Output: Use the "audio out" node for alerts
Template Node: Create custom HTML widgets
    {{msg.payload.device_name}}

        {{msg.payload.temperature}}°C

    Last updated: {{msg.payload.timestamp}}
Best Practices
Performance Optimization
- Limit chart data points (use aggregation for long time periods)
- Debounce rapid updates
- Use "delay" node to rate-limit updates
- Close unused dashboard tabs in browser
Security
- Enable authentication in settings.js
- Use HTTPS in production
- Implement role-based access control
- Sanitize user inputs
Maintainability
- Use subflows for reusable components
- Comment your flows and functions
- Version control your flows (Git)
- Document dashboard structure
Deployment
To access your dashboard:
- Local: http://localhost:1880/ui
- Remote: http://your-server-ip:1880/ui
For production deployment:
- Configure authentication
- Set up reverse proxy (Nginx)
- Enable HTTPS with Let's Encrypt
- Configure firewall rules
- Set up systemd service for auto-start
Conclusion
Node-RED Dashboard provides a powerful, flexible way to visualize IoT data in real-time. With its drag-and-drop interface and extensive widget library, you can create professional dashboards in minutes. Start simple, then gradually add complexity as your needs grow.
The complete flow for this tutorial is available on GitHub. Import it into your Node-RED instance to see the dashboard in action!
Lisa Anderson
Expert IoT consultant and technical writer with years of experience in industrial automation and smart systems.


